Remember those dreaded math tests in school, filled with charts and calculations? There’s a good chance you encountered terms like mean, median, mode, and range – concepts that might have seemed abstract and confusing at the time. But these statistical measures are actually powerful tools that help us understand and interpret data in everyday life. Whether it’s analyzing sales trends, determining the average temperature in your city, or figuring out the most popular ice cream flavor among your friends, these measures offer insights into the world around us.

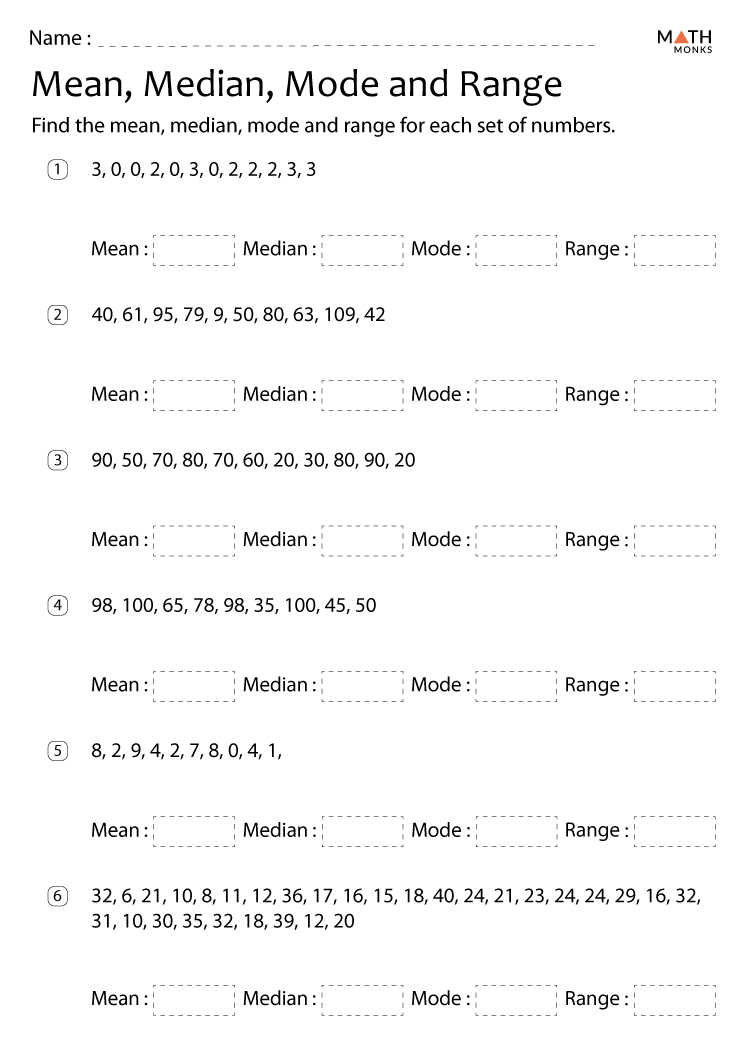
Image: classfullschmitt.z21.web.core.windows.net
In this article, we’ll delve into the fascinating world of mean, median, mode, and range – exploring what they represent, how to calculate them, and why they are so important for understanding and interpreting data. Ready to unlock the secrets of these fundamental statistical measures? Let’s dive in!
What are Mean, Median, Mode, and Range?
These four concepts are considered measures of central tendency and dispersion in statistics. They provide a succinct summary of a dataset, helping us understand the distribution of data points within it. Let’s break down each term:
Mean
The mean, often referred to as the average, is the sum of all values in a dataset divided by the total number of values. It provides a central point that balances the data, offering a sense of the typical or representative value. For instance, if you want to know the average height of students in a class, you calculate the mean by adding up the height of each student and dividing by the total number of students.
Median
The median is the middle value in a dataset when the values are arranged in ascending order. It divides the data into two equal halves, with half the values being greater than or equal to the median and half being less than or equal to it. For example, if you have seven numbers in a dataset, the median would be the fourth number. If you have an even number of values in your data set, then the median is the average of the two middle numbers. The median is particularly useful for analyzing skewed data because it’s less affected by outliers compared to the mean.

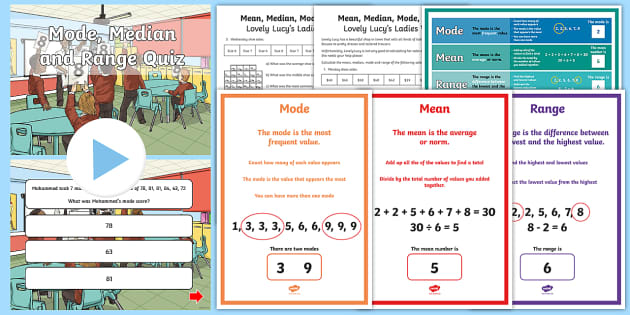
Image: www.twinkl.cl
Mode
The mode is the value that appears most frequently in a dataset. Essentially, it tells us the most common value within the data. A dataset can have more than one mode if multiple values are tied for the most frequent appearance. For example, if you’re analyzing the favorite colors of 100 people, and 30 people choose blue, 25 people choose red, and 25 people choose green, blue would be the mode as it appears most frequently in the dataset.
Range
The range represents the difference between the highest and lowest values in a dataset. It gives us an idea of the spread or variability of the data. A larger range implies a wider spread of values, while a smaller range indicates a more clustered set of values. Imagine analyzing the temperatures in a city over a month. The range would be calculated by subtracting the lowest temperature from the highest temperature, giving us an indication of the temperature variation experienced within that month.
Real-World Applications of Mean, Median, Mode, and Range
These statistical measures aren’t just confined to the realm of math textbooks. They’re used extensively in various fields, offering valuable insights for decision-making and problem-solving. Here are a few examples:
- Business: Companies use these measures to analyze sales figures, consumer preferences, and market trends. For example, the mean average sales per month can reveal overall performance, while the median helps understand typical sales figures while disregarding potential outliers.
- Healthcare: Medical professionals utilize these measures to understand patient data, such as blood pressure readings, cholesterol levels, and weight, making informed diagnoses and treatment decisions.
- Education: Teachers rely on these measures to analyze student performance and identify areas that require extra support. For example, the mean score on a test can indicate the overall performance of the class, while the range can reveal how widely student scores vary.
- Social Sciences: Researchers use these measures to analyze surveys, demographic data, and social trends, uncovering patterns and understanding societal dynamics.
Tips for Utilizing Mean, Median, Mode, and Range
Understanding how to leverage these measures effectively can significantly impact your ability to interpret and analyze data. Here are some practical tips:
- Choose the right measure for the situation: Each measure provides a different perspective and interpretation of the data. The mean might be a good measure for understanding the average value, while the median provides a more robust measure for skewed data. The mode is helpful for identifying the most frequent value, while the range gives us an idea of data spread.
- Consider context: Interpret the results within the context of the data. The average salary in a city might seem high, but it could be skewed by a few high earners. Examine the median salary to get a better understanding of the typical salary in the city.
- Be aware of outliers: Outliers are extreme values that can significantly influence the mean. The median can help minimize the impact of outliers in skewed datasets.
- Look for trends and patterns: Compare these measures across different data sets or time periods to identify trends and patterns. For example, tracking the average sales figures over a year can reveal trends in consumer behavior.
FAQs About Mean, Median, Mode, and Range
Here are some frequently asked questions about these measures:
Q: Are all four measures always necessary?
A: No, you don’t always need to calculate all four measures for every dataset. The specific measures you choose depend on the type of data, your research objectives, and the insights you’re trying to gain.
Q: Can a dataset have multiple modes?
A: Yes, a dataset can have multiple modes. This happens when two or more values appear with the same highest frequency.
Q: How can I calculate these measures using technology?
A: Many online tools and software packages can calculate these measures for you. Spreadsheets like Microsoft Excel and Google Sheets have built-in functions to quickly calculate mean, median, mode, and range.
Q: Why is it important to understand these measures?
A: Understanding these measures helps us to make sense of data, draw meaningful conclusions, and inform decisions. They provide a framework for analyzing information and recognizing patterns, which can be valuable in various aspects of life.
Mean Mode Median And Range Math-Aids.Com
https://youtube.com/watch?v=1MfTYmeevEU
Conclusion
Mean, median, mode, and range are fundamental statistical measures that empower us to understand and interpret data more effectively. They provide insights into central tendencies, data dispersion, and the presence of outliers. By mastering these concepts and applying them within relevant contexts, you can gain a deeper understanding of the world around you and harness the power of data.
Are you interested in learning more about these measures and exploring their diverse applications? Let us know in the comments below!


